Our long-term goal is to support producers in the High Plains (and beyond) to adopt management strategies that are profitable and build soil and ecosystem health. Further information on this study and managing spring-planted cover crops for livestock grazing can be found using the following link: extension.colostate.edu/topic-areas/agriculture/managing-spring-planted-cover-crops-for-livestock-grazing-under-dryland-conditions-in-the-high-plains-region-0-309/
|
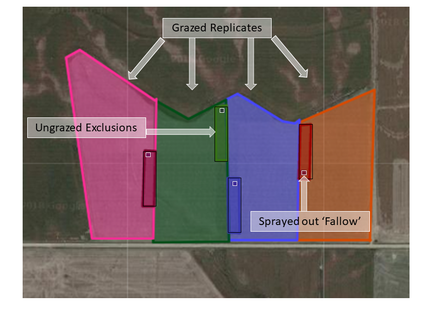
The spring cover crops were planted mid-March to early April. The field size varied from 42-100 acres. Fields were laid out with 4 large paddocks and 4 ungrazed exclusion areas. Small 15 x 30 ft areas were sprayed out to simulate 'fallow' conditions. Cattle were grazed an average of 30 days in 2016 and an average of 26 days in 2017. Each replicate was grazed for about a week. After termination, the spring planted fields were planted with wheat. |
Cover Crop Composition and Growth
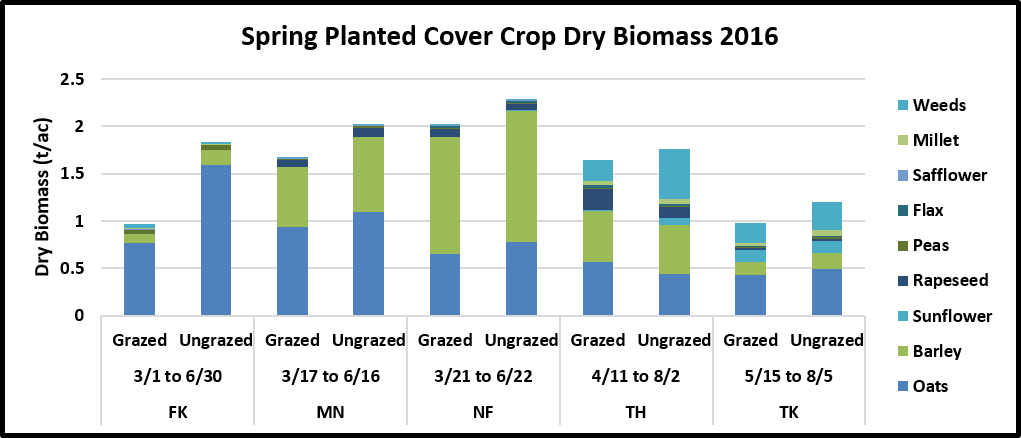
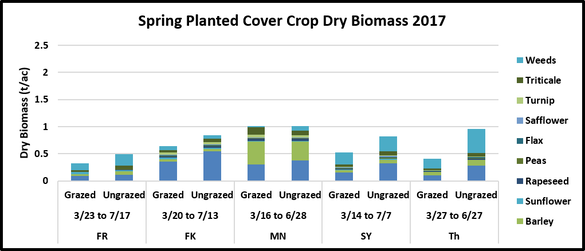
The graphs above show the species composition of the forage biomass samples collected in 2016 and 2017. The 2016 cover crop mixture averaged 1.5 t/ac in the grazed and 1.8 t/ac in the ungrazed. The 2016 mix was dominated by oats and barley and the 2017 mixture was adjusted to 10# of each. The 2017 cover crop mixture averaged 0.7 t/ac in the grazed and 0.8 t/ac in the ungrazed.
Soil Health
|
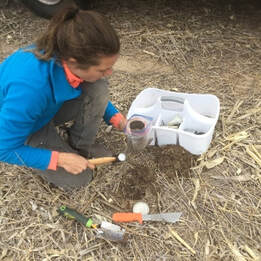
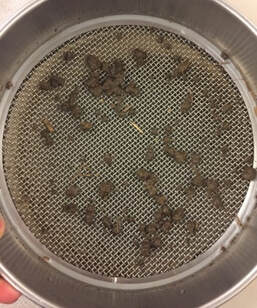
We measured bulk density as an indicator of soil compaction in the top 2 inches of the grazed, ungrazed, and fallow areas. Grazed cover crop and fallowed areas had the same bulk density. Ungrazed cover crop areas had slightly lower bulk density than the other treatments, suggesting that the growing cover crop roots without the presence of grazing decreased soil compaction. All bulk density values are within an acceptable range for management. In both years, soil aggregation increased in the top 2 inches of the grazed cover crop relative to fallow areas.
Just 90 days of a growing cover crop improved soil aggregation, the ability of the soil to clump or hold together and is usually related to the water infiltration potential of a soil. Cover crops consistently increased soil aggregate stability in the top 2 inches of soil in both years relative to fallowed areas. Grazing did not affect bulk density relative to fallow, suggesting that grazing did not increase soil compaction relative to non-grazed areas. A single season of cover crop growth did not influence other soil health indicators that were measured, which is not surprising given the short study length. Total soil organic C and N, permanganate-oxidizable C (POXC) and potentially mineralizable nitrogen (PMN) did not differ across treatments |
Soil Moisture
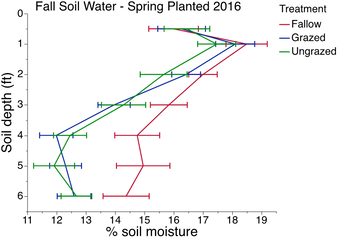
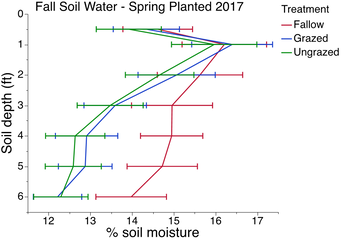
The above graphs show differences in soil moisture at wheat planting. Precipitation during the summer fallow period reduced differences in soil moisture in the surface layers. Fallow treatments had more moisture at greater depths. There were no differences between the grazed and ungrazed treatments indicating that the grazing did not have an effect on soil moisture.
Cattle Gains |
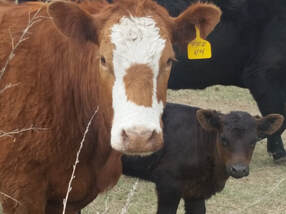
Farms varied in what they grazed with and the stocking rates. Some farms grazed yearling steers and other producers used cow/calf pairs or heifers. Cattle stocking rates varied from 274 lbs/ac to 939 lbs/ac. We collected cattle weights individually going onto and coming off of the field, though the grazing period and weighing conditions were not ideal for accurately measuring animal performance.
With that caveat, typical ADG ranged from 1 lb/day to over 3 lb/day across the two years, likely varying widely due to stocking rate and biomass availability differences. In general, animals gained well on the grazed cover crops, providing producers with an extra source of forage that would have had to been fed out otherwise.
With that caveat, typical ADG ranged from 1 lb/day to over 3 lb/day across the two years, likely varying widely due to stocking rate and biomass availability differences. In general, animals gained well on the grazed cover crops, providing producers with an extra source of forage that would have had to been fed out otherwise.
Wheat Yields
|
Across farms the fallow treatment had ~10 bu/ac greater wheat grain yield (table on right). There was no difference between Grazed and Ungrazed treatments.
2016: 1 out of 4 fields with yield reduction 2017: 1 out of 3 fields with yield reduction |
