Evaluating Cover Crop and forage Mixtures for Dryland Systems
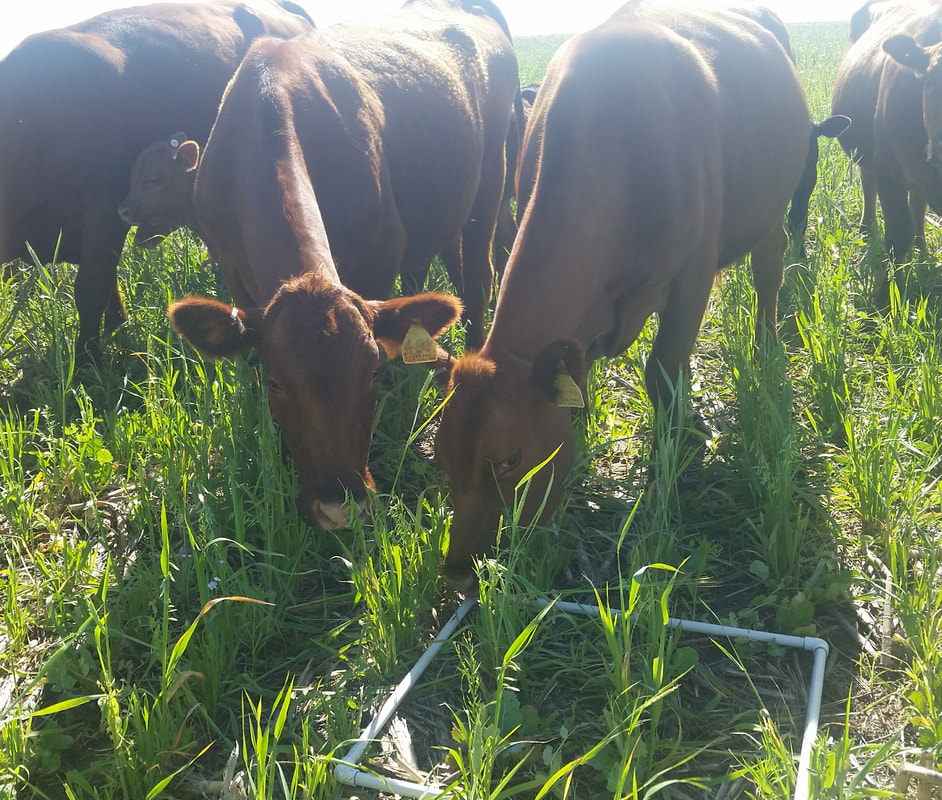 Grazing cows during forage collection. Grazing cows during forage collection.
|
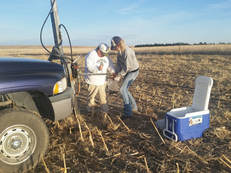
Soil sampling in the early spring before planting.
|
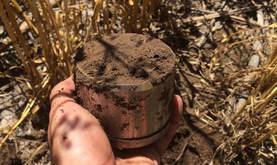
Determining soil bulk density after grazing.
|
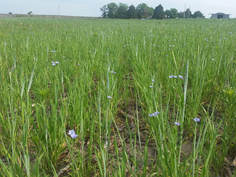
Flax blooming in the sea of spring planted forage.
|
Our long-term goal is to support producers in the High Plains (and beyond) to adopt management strategies that are profitable and build soil and ecosystem health.
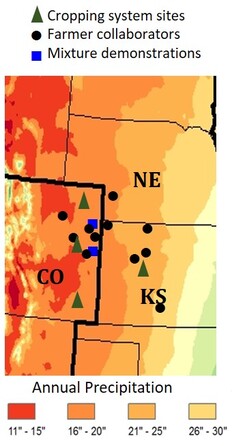
We focused on adaptation of conservation practices for the High Plains region that includes eastern Colorado, western Nebraska, and western Kansas.
|
: Through a collaboration between producers, Colorado State University, Kansas State University, and NRCS, we evaluated the potential for grazed cover crops to support profitability and soil health within dryland cropping systems of the High Plains region.
Objective 1: Demonstrate and quantify the impacts of replacing fallow with cover or forage crops on subsequent cash crop yields, soil health and water use. Objective 2: Demonstrate and quantify the impacts of grazed vs. ungrazed cover crop mixtures on farm economics, soil health, weed populations and density, pollinator diversity and water use. Objective 3: Identify mixtures that balance productivity, forage quality, support pollinator diversity, and limit seed costs. Objective 4: Identify barriers to the adoption of more intensified rotations in dryland cropping systems including the use of cover crops for grazing and/or haying. A Fact Sheet with further information on managing spring-planted cover crops for livestock grazing can be found using this link: extension.colostate.edu/topic-areas/agriculture/managing-spring-planted-cover-crops-for-livestock-grazing-under-dryland-conditions-in-the-high-plains-region-0-309/ A Fact Sheet with further information on managing post-wheat-planted cover crops for livestock grazing can be found using this link: webapp.agron.ksu.edu/agr_social/article_new/cover-crops-grown-post-wheat-for-forage-under-dryland-conditions-in-the-high-plains-400-4 |
